Overview
Build production-grade backends with a single primitive - APIs, background jobs, workflows, and AI agents unified
Build production-grade backends with a single primitive.
Motia is a unified backend framework that combines APIs, background jobs, durable workflows, AI agents, streaming, and observability around one core primitive: the Step.
Want an API? That's a Step. Need a background job? That's a Step. Scheduled task? Also a Step.
Write each Step in whatever language makes sense — TypeScript, Python, or JavaScript. Each language runtime runs independently, managed by the iii engine, and they all share the same state and communicate through queued messages.
Naming Clarification: Motia vs iii
| Name | Role |
|---|---|
| Motia | The framework/SDK you import in application code (import { step, enqueue, stateManager } from 'motia') |
| iii | The runtime engine that runs infrastructure modules (queue, state, stream, cron, HTTP, observability) |
In short: you write Motia code, and iii runs it.
How It Works
Every Step is just a file with two parts:
1. Config → When and how it runs 2. Handler → What it does
Drop this file in your src/ folder and Motia finds it automatically. No registration, no imports, no setup.
Event-Driven Architecture
Steps don't call each other. They enqueue messages to topics that other Steps consume.
This means:
- Your API can trigger a background job without waiting for it
- Steps run independently and retry on failure
- You can add new Steps without touching existing ones
- Everything is traceable from start to finish
Example: An API enqueues a message, a queue Step picks it up:
That's it. No coupling, no dependencies.
Project Structure & Auto-Discovery
Motia automatically discovers Steps - no manual registration required.
Basic Structure
The src/ directory is the heart of your Motia application. All your workflow logic lives here, and Motia automatically discovers any file following the naming pattern.
Auto-Discovery Rules
Motia scans the src/ directory and automatically registers files that:
-
Match naming pattern:
- TypeScript:
.step.ts - JavaScript:
.step.js - Python:
_step.py(note: underscore beforestep)
- TypeScript:
-
Export a
configobject with Step configuration -
Export a
handlerfunction with business logic
No imports. No registration. Just create the file and Motia finds it.
Multi-Language Support
Every Step can be in a different language. Each language runtime runs as an independent process managed by the iii engine — Python developers do not need Node.js, and vice versa. All runtimes share the same state and communicate through the same queue infrastructure.
Currently Supported:
- TypeScript
.step.ts - Python
_step.py(standalonemotiaPython package — no Node.js required) - JavaScript
.step.js
Example project:
All three Steps work together. TypeScript API enqueues a message, Python processes with ML, JavaScript sends the result.
Core Concepts
State Management
Persistent key-value storage that works across all Steps and languages. stateManager.set returns { new_value, old_value }.
Real-Time Streams
Push live updates to connected clients (browsers, mobile apps).
Clients receive updates instantly.
Infrastructure via config.yaml
All infrastructure — queues, state storage, streams, cron scheduling, and observability — is configured through config.yaml modules managed by the iii engine. Swap default file-based storage with Redis or RabbitMQ without changing your application code.
Context Object
Every handler gets a context object with:
| Property | What It Does |
|---|---|
traceId | Request tracing |
trigger | Trigger metadata |
is | Type guards for trigger types |
getData() | Get typed trigger data |
match() | Pattern matching on trigger |
Motia + iii
Motia is the application framework — you write Steps in TypeScript, Python, or JavaScript. The iii engine is the runtime that powers everything underneath: it manages queues, state storage, stream servers, cron scheduling, HTTP routing, and observability.
You configure iii through a config.yaml file that declares which modules to load and how to configure their adapters (file-based for development, Redis/RabbitMQ for production). The iii engine then manages the lifecycle of your Motia SDK processes via the ExecModule.
Learn more about the iii Engine
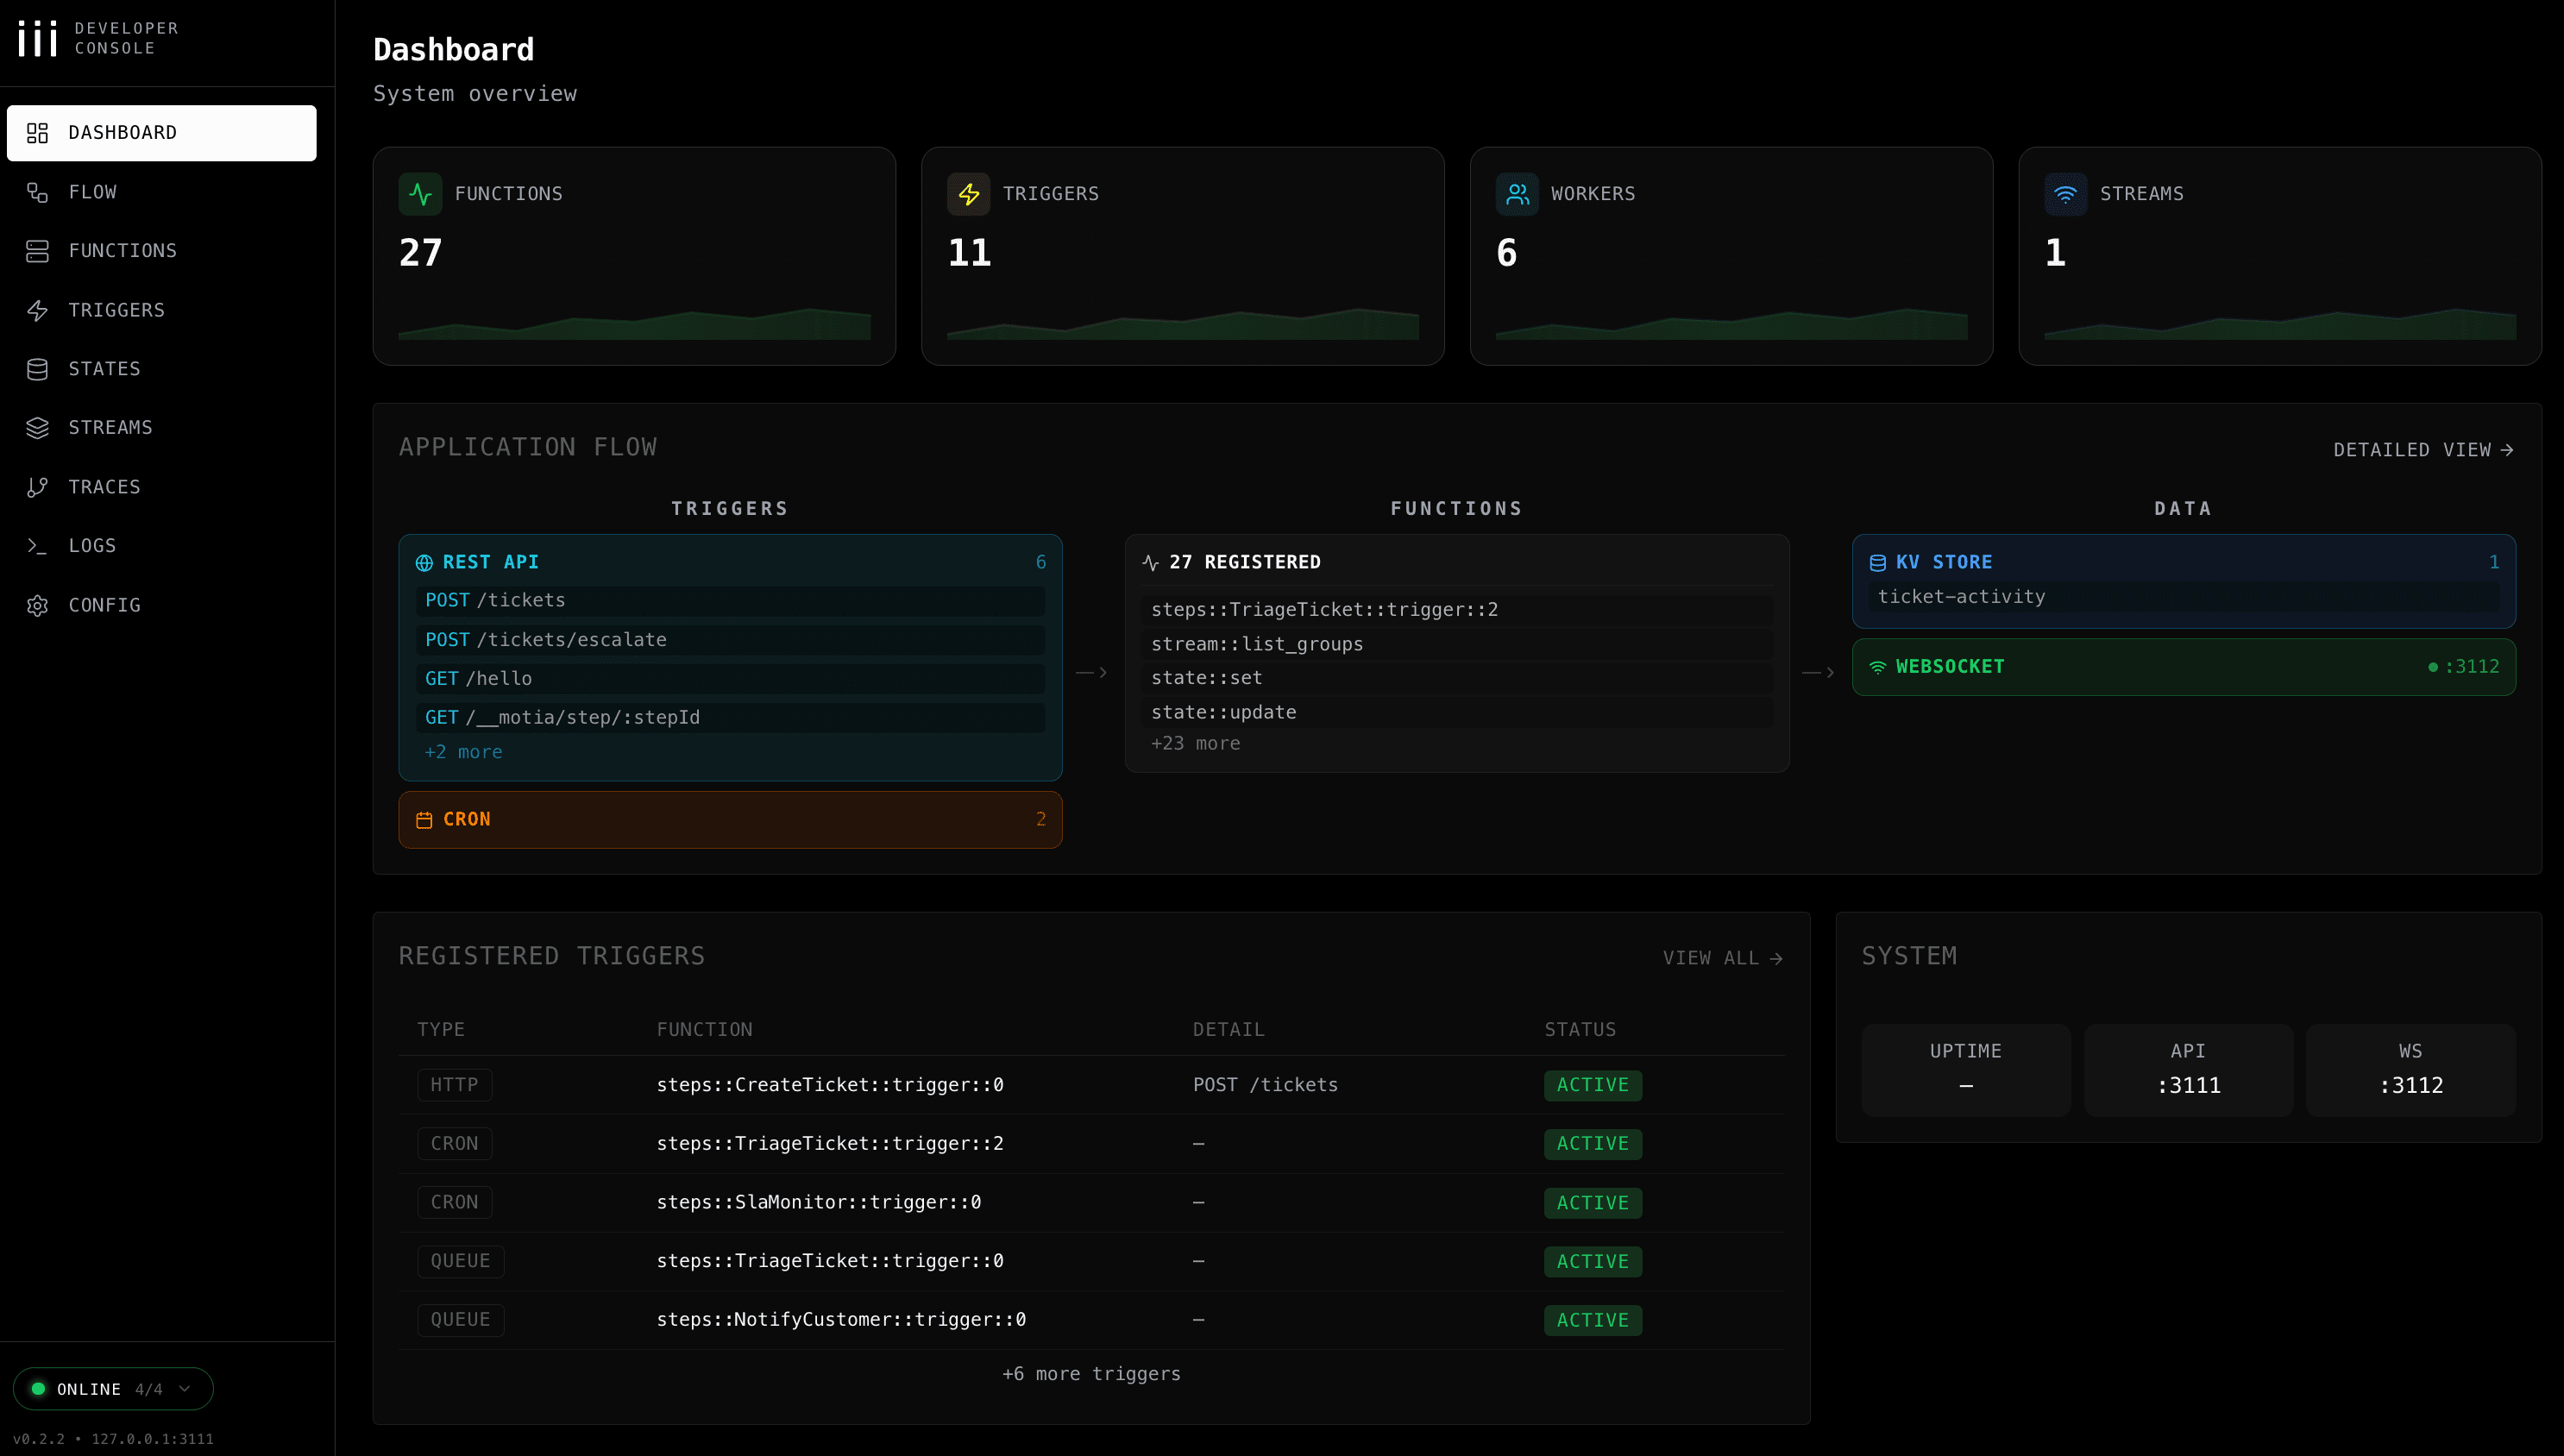
Development Tool - iii Development Console
Visual interface for building and debugging flows:
- See your entire flow as a beautiful diagram
- Watch logs in real-time
- Inspect state as it changes
- View stream updates in real-time
Learn about the iii development console